Location intelligence and venue revenue calculator
Model your venue's financial return from WiFi and BLE location analytics. Benchmark footfall, increase dwell time, eliminate dead zones, and grow revenue per visitor.
75 to 84 min dwell (+9 min from flow tuning and wayfinding), worth +1.8% spend per visitor.
4,860 visits redirected from bottlenecks to quiet zones.
105,840 distinct consented records, from 252,000 opt-ins a year once repeat sign-ins are deduplicated.
Labor reallocated based on real-time spatial occupancy across 12 zones.
1. Zone conversion benchmarking
Compare footfall conversion across physical departments. Identify which entrances drive highest basket sizes and which corridors cause drop-offs.
2. High-value dwell triggers
Automate real-time triggers when a visitor dwells in a high-margin product zone for longer than 3 minutes without purchasing.
3. Tenant and endcap pricing proof
Use empirical pass-by rates and median dwell figures to validate premium leasing rates for high-traffic physical zones.
Hardware-agnostic positioning accuracy matrix
Zero hardware added. Runs on existing Meraki, Aruba, Ruckus, or Cisco APs.
Ideal for precise aisle-level engagement and turn-by-turn wayfinding.
IEEE 802.11az round-trip time calculation without client calibration.
High-precision asset tracking in clinical, warehousing, and secure estates.
Turn your venue footfall into measurable revenue
Purple runs on the WiFi and network hardware you already own. Request a custom location audit for your estate.
Executive summary
Physical venues generate vast volumes of spatial footfall data every day. When visitors enter a retail store, hotel, transport terminal, or healthcare campus carrying smartphones, their devices emit wireless radio frequency (RF) signals that interact with the venue access points. Location analytics captures, aggregates, and transforms these signals into actionable spatial intelligence - turning physical footfall into measurable revenue gains.
Deploying cloud-managed location intelligence on existing enterprise wireless infrastructure allows venue operators to correlate visitor dwell time with Point-of-Sale (POS) transactions, identify floorplan bottlenecks, eliminate underperforming dead zones, and deliver consent-driven marketing triggers. This technical guide explains how WiFi and Bluetooth Low Energy (BLE) location services operate, compares indoor positioning technologies, and details proven strategies to generate quantifiable returns from spatial data.
Key takeaways: venue location analytics and revenue
- Zero Hardware Overlay: Enterprise WiFi networks (Cisco Meraki, HPE Aruba, Ruckus, Juniper Mist) capture footfall telemetry passively using existing access points without requiring expensive sensor overlays.
- Dwell Time Drives Basket Size: Increasing average visitor dwell time by 8.5% correlates with an average 10% to 12% lift in retail basket size and secondary hospitality spend.
- Path-to-Purchase Optimisation: Spatial heatmaps identify underutilised floor areas, allowing visual merchandisers to relocate high-margin products to high-traffic pathways.
- First-Party Data Integration: Pairing location analytics with a branded captive portal turns anonymous footfall into verified CRM profiles with 50% to 80% capture rates.
- Privacy-Preserving Architecture: One-way cryptographic MAC address hashing ensures full compliance with GDPR, CCPA, and global data protection frameworks.
What is location analytics in physical venues?
Location analytics is the process of collecting, processing, and interpreting geospatial and spatial data generated by connected devices within a physical environment. In enterprise facilities, location engines measure presence, footfall volume, dwell duration, repeat visit frequency, and zone-to-zone movement patterns.
By establishing virtual spatial zones (geofences) across floorplans, operators track how visitors transition between specific departments, entrance portals, dining areas, and checkout queues. When integrated with transactional systems like POS terminals and CRM platforms, location analytics bridges the intelligence gap between offline physical spaces and digital analytics platforms.
How indoor positioning technologies compare
Different indoor location technologies provide distinct tradeoffs in positioning accuracy, hardware requirements, and client software dependencies. Choosing the right technology depends on your venue architecture and operational objectives.
4 ways location analytics directly increases venue revenue
Modern venue operators use location intelligence to drive tangible commercial outcomes across customer experience, merchandising, and operations.
1. Optimising store layouts and eliminating dead zones
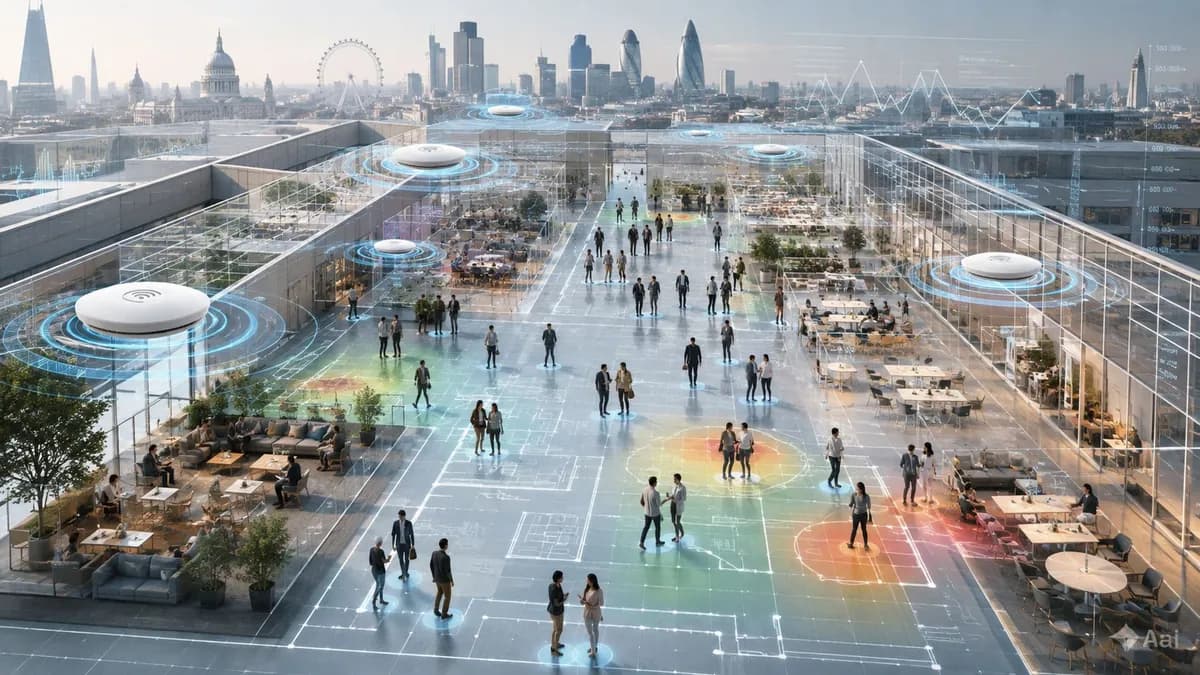
Physical retail and entertainment venues often suffer from unbalanced traffic flow, where certain aisles or zones experience heavy crowding while adjacent commercial square footage remains unvisited. Spatial heatmaps reveal visitor flow and bottleneck points in real time.
Venue managers can rearrange gondolas, promotional endcaps, and signage to redirect traffic toward underutilised zones. In multi-brand department stores and retail malls, footfall data provides objective evidence to justify premium rental rates for high-traffic zones.
2. Correlating dwell time with Point-of-Sale (POS) conversion
Dwell time measures the duration a visitor spends in a specific zone or near a particular product category. In retail and hospitality, dwell time correlates directly with conversion propensity. Research shows that every 1% increase in visitor dwell time generates approximately 1.3% higher average transaction value.
By comparing hourly dwell patterns against POS checkout data, operators determine the optimal engagement window. If visitors in a clothing department dwell for 15 minutes but abandon before purchase, managers can test interventions such as active staff assistance or mobile digital assistance to recover lost sales.
3. Automating personalised proximity engagement
When visitors connect to guest WiFi through a captive portal, they provide verified contact credentials and explicit marketing consent. By linking this authenticated profile to real-time location telemetry, venues can trigger automated, contextually relevant offers.
For example, a visitor who enters an entertainment stadium two hours before kickoff can receive a direct mobile push or SMS voucher for concession stands in their seating section, driving incremental high-margin food and beverage sales before the event begins.
4. Dynamic staffing and labour cost reduction
Labour represents one of the largest operational expenses for physical venues. Over-staffing during quiet periods inflates overheads, while under-staffing during footfall surges creates long checkout queues, frustrated visitors, and lost revenue.
Historical footfall trends and predictive location models allow managers to align shift schedules with verified visitor demand. Cleaning, customer support, and cashier personnel can be dispatched dynamically based on real-time zone occupancy thresholds.
Ensuring visitor privacy: GDPR and MAC address randomisation
Modern smartphone operating systems (iOS and Android) utilise MAC address randomisation to protect user privacy when scanning for wireless networks. Location analytics platforms must operate within strict legal frameworks, including GDPR in Europe and CCPA/CPRA in the United States.
Purple handles privacy by design through the following controls:
- One-Way Cryptographic Hashing: Raw MAC addresses detected from wireless probe requests are immediately passed through a one-way cryptographic SHA-256 hash combined with a rotating salt, preventing reverse lookup.
- Aggregated Statistical Modelling: Presence metrics, dwell calculations, and pathing models are aggregated into anonymous statistical cohorts rather than tracked as individual identities.
- Explicit Consent Binding: Identifiable customer profiles are only created when a visitor explicitly registers through a branded captive portal with full opt-in consent checkboxes.
- Configurable Data Retention: Raw probe logs are automatically scrubbed in accordance with localised data retention policies.
Vendor-agnostic deployment on existing wireless hardware
A major advantage of cloud-native location analytics is hardware independence. Rather than deploying proprietary beacons or sensors across hundreds of thousands of square feet, platforms like Purple ingest location telemetry directly from enterprise wireless controllers via cloud APIs and webhooks.
Supported hardware ecosystems include:
- Cisco Meraki: Native integration with Scanning API for real-time location feeds.
- HPE Aruba: Integration with Aruba Central and Aruba Meridian location engines.
- Ruckus (CommScope): Direct telemetry via Ruckus SPoT (Smart Positioning Technology) and Ruckus One.
- Juniper Mist: Integration with Mist Virtual BLE (vBLE) arrays and AI-driven location telemetry.
Conclusion: turning footfall into a measurable growth engine
Physical venues no longer need to operate in the dark compared to their digital e-commerce counterparts. Location analytics provides the granular visibility needed to understand visitor behaviour, streamline operations, and drive measurable revenue uplift across every square foot of physical space.
Whether you manage a national retail chain, a multi-wing hospital campus, or a premier sports arena, Purple delivers the enterprise location intelligence and guest WiFi tools required to maximise physical asset yield on the network hardware you already own.