
Offline space and captive portal A/B testing calculator
Calculate the statistical sample size, test duration, and footfall conversions required to validate store layout, window display, and captive portal experiments.
Guest WiFi login and marketing opt-in rate
Visitors in range of the guest network each month (~822 a day)
Current performance without test variants
Target rate: 21.6%
Two-tailed alpha significance threshold (1.96 z)
Experiment blueprint: Captive portal onboarding flow
Purple captive portal authentication engineSingle-step email capture vs two-step social login vs survey modal. Keep all secondary variables (store promotions, staffing levels, opening hours) constant across test cohorts.
Capture automated timestamped telemetry through Purple WiFi access point sensors and captive portal logs. Do not stop the test before the full 14-day window closes: peeking early is what turns a run of good days into a false positive.
Ready to A/B test your venue layouts with WiFi analytics?
Purple runs captive portal split testing, footfall counters, and dwell time heatmaps on Cisco Meraki, HPE Aruba, Ruckus, Juniper Mist, and Ubiquiti UniFi hardware.
Offline A/B test calculator & significance simulator
Simulate physical venue split tests. Calculate statistical confidence, required sample sizes, and revenue impact using WiFi footfall analytics.
Compare traffic flow and dwell time across two floor plans to measure basket conversion impact.
Variant B shows a +21.4% conversion lift with 99.9% confidence. Recommended action: roll out variant B across matching venue zones, and check the result was not driven by a one-off event or weather.
Want to run split tests across your physical locations?
Purple overlays existing enterprise wireless to provide footfall heatmaps, dwell times, and captive portal analytics.
There are many different ways that businesses try to test out new website designs, marketing campaigns and with the use of WiFi Analytics, even store layouts and window displays.
But to ensure that these campaign resources and efforts aren't wasted, it's important to ensure that companies have clear outcomes and can record their data accordingly.
One of the most effective ways to test out different variants is to A/B test them.
What is A/B testing?
A/B testing (also known as split testing) is the process of comparing two versions of a web page, email, or other marketing asset and measuring the difference in performance.
You perform this test by giving one version to one group and the other version to another group. Testing out the 2 variations and recording the data.
In the online world, companies are constantly A/B testing different images, layouts, CTA buttons etc to see what converts the best and as a result what drives the most revenue and customer loyalty.
In the offline world, this has traditionally been much more difficult due to the lack of data and insights. However, over the past decade or so existing technology such as WiFi is starting to be used to produce similar insights as online tools.
Why should my business A/B test?
To simply put it accurately A/B tests can make a huge difference to your bottom line. By using controlled tests and gathering the data, you can figure out exactly which marketing strategies work best for your company and your product.
A/B testing lets you know what words, phrases, images, videos, testimonials, and other elements work best. Even the simplest changes can impact conversion rates.
Benefits of A/B Testing are:
- Reduce bounce rate
- Get better ROI from existing traffic
- Make minor, risk-free changes to your website or venue
- Understand how visitors engage with your venue or website
- Make profitable redesigns to your website or venue
What should I A/B Test?
Virtually everything is testable, if you can change it, you can test it.
It's important though to remember, just because everything can be tested, it doesn't mean that it should be.
Focus on the things that are most likely to have the biggest impact on your bottom line. For example, online businesses may test website copy, CTA's, colour schemes, graphics, headlines, etc anything that is likely to contribute to the user/visitor converting.
For offline businesses, this could be the way products are laid out in your store or in the window display, and with the use of WiFi analytics, offline businesses can A/B test their stores to optimise their layouts, increasing the likelihood of purchases.
Something that applies to both offline and online businesses is testing different offers.
Just make sure that you have methods in place to ensure that each person is always offered the same promotion. For example, if a free gift is offered to group A, and a discount is offered to group B, then you want to make sure that group A always contains the same visitors, as does group B.
The best tool for online A/B testing
For A/B testing you're going to need a few things to ensure its success: the right KPIs, access to the necessary data, and a good set of tools to help run successful tests.
Online businesses should look no further than Google Optimize for their A/B testing needs, this free tool from Google is one of the best and simplest tools you can use, check out how to get set up in the video below
There are two key elements to Google Optimize:
A visual editor, which lets you create altered versions of your pages, to test different HTML content options against one another (e.g. in Version A, the web page shows a green CTA button; in Version B, the same button is red). The editor works with a range of device-type views, including mobile.
A reporting suite, which uses data from your linked Google Analytics account to provide insight into the experiments you set up using the editor.
The editor and reporting suite are used together to set up and analyse experiments, displaying what works best on your web page.
The best tools for offline A/B testing
Throughout this blog there have been references to replicating online tests in the offline world which may leave you asking, how can I replicate something online-based offline?
This can be achieved in a number of ways.
WiFi Analytics & Marketing
Purple's Guest WiFi solution easily overlays onto existing hardware infrastructure to provide quick setup and a new method for collecting primary data collection.

Upgrading existing WiFi services with WiFi Analytics insights enables business venues to understand who their visitors are. Enhancing the way visitors get online with a completely branded captive portal encourages customers to provide demographic information in exchange for access to free WiFi services.
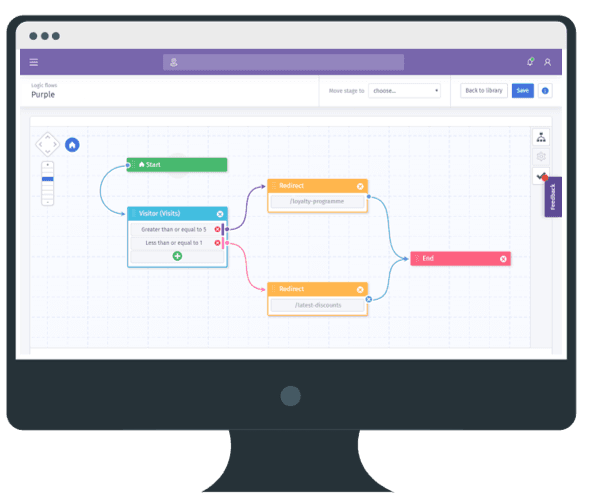
Sending personalised marketing and offers can make all the difference between a one-time purchase and creating a loyal customer. Knowing when to deliver marketing and offers can be a challenge but through data segmentation, businesses can create hyperfocused messages that deliver when visitors are in-store to encourage higher basket sizes and loyalty sign-ups.
Test messages, times of the day, seasonality, and more to determine when groups of customers are the most receptive.
Tracking customer movement
Purple's Sensors software connects with existing WiFi access points and sensors to identify footfall and understand how visitors move around your venue.
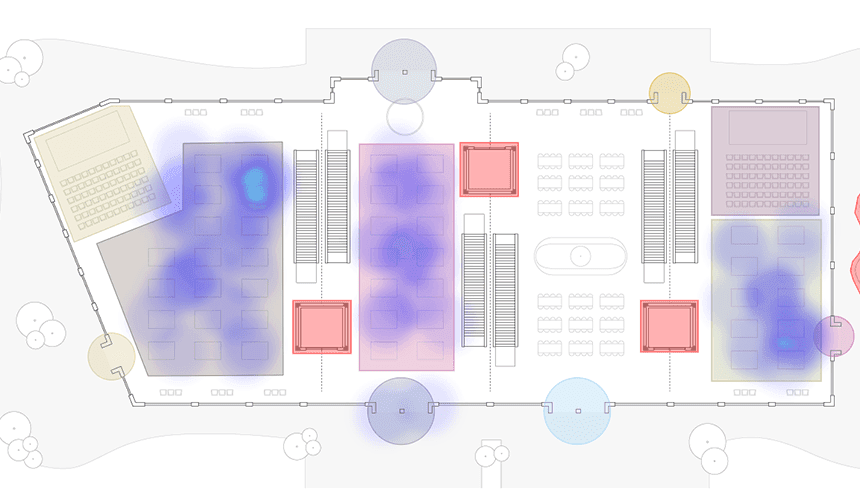
This information is then fed directly into the analytics platform where users can filter and segment the data to identify patterns and trends.
As the collection of data increases stores can optimise window displays, validate product placement, and A/B test new store concepts with clear visual outcomes.
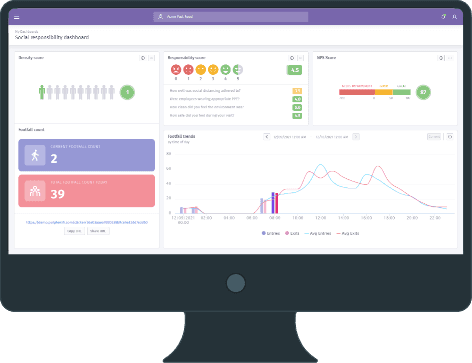
There's more to find out! Take a look at our Operational Efficiency use cases.