Location data provides more intelligence than just x and y. Yes, it can tell you how many people visit your venue, but did you know it can also be used to track visitor movement throughout your venue? Opening the doors for proximity marketing, way-finding, personalized customer engagement and more. The data can also feed into various systems such as loyalty programs and apps to improve the customer experience.
So let’s break this down, starting with presence data.
Presence data
Presence data counts the number of devices seen by a source (whether that is a Bluetooth beacon or WiFi access point (AP)) based on pings. A ping is the signal that is sent from the customer’s device to nearby devices. The response time of the connection determines the seen time for presence data.
There are two device types that allow you to capture presence data. Active and passive.
- Active devices: Beacons (low energy Bluetooth transmitters) – where Bluetooth enabled devices constantly probe to the source.
- Passive devices: WiFi systems – where WiFi enabled devices, such as cameras and mobile apps, probe at different intervals to the source.
The table below shows average interval times for smartphones. Note that intervals may vary depending on vendors (iOS, Android), apps, device upgrades, and other factors.
| Device state | Probe request interval (smartphone) |
|---|---|
| Asleep (screen off) | ~ Once per minute |
| Standby (screen on) | 10 – 15 times per minute |
| Associated | Varies, could require use to manually search for networks |
Understanding device location
How can we provide a unified solution to magically transform this presence data into location information that businesses can use to drive revenue?
Factors involved in achieving this are:
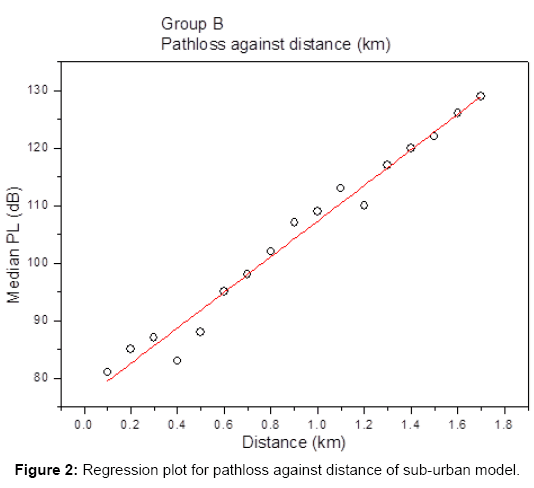
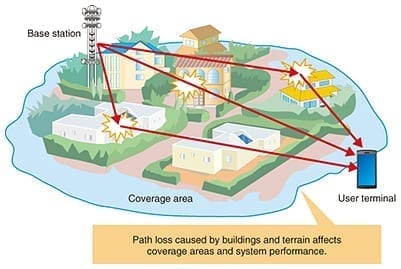
Path loss and signal propagation
Signal path loss is the reduction in power density of a signal as it propagates through the space it is travelling.
Path loss (PL), is the distance (d) between the sender (TX) and the receiver (RX), where (f) is the frequency and (32.45) the coefficient.
This is the basic model for all path loss models:
PL=32.45+20log10(d)+log10(f)
Received Signal Strength Indicator (RSSI)
RSSI is a term used to measure the relative quality of a received signal to a device.
RSSI, provided by most platforms, offers a powerful and cost-effective mechanism to derive path loss models, crucial in critical infrastructures for a good network planning. However, in few cases, we have identified a series of factors that have non-negligible negative effects on reported RSSI readings and therefore, on the quality of observed path loss models (shown in the diagram below).
These sources of perturbations are classified as intrinsic (impact of the transceivers, connectors and anten-nas) or extrinsic factors (number of acquired measurements, coexisting interfering devices, effect of temperature, length of transmitted packets, battery level of devices and environmental conditions).
Received signal power
Purple uses a more standardized, absolute measure of signal strength: Received signal power, which is measured in decibels, or dBm on a logarithmic scale. There’s a lot of math we could get into, but basically it’s a measurement of signal loss, so technically it’s signal remaining as a proportion of the original.
Signal strength indicator for WiFi systems
| Signal strength | Quality | Description |
|---|---|---|
| -30 dBm | Amazing | Max achievable signal strength. The customer can only be a few feet from the AP to achieve this. Not typical or desirable in the real world. |
| -50 to -60 dBm | Very Good | Minimum signal strength for applications that require very reliable, timely delivery of data packets. |
| -65 to -70 dBm | Okay | Minimum signal strength for reliable packet delivery. |
| -75 dBm | Low | Minimum signal strength for basic connectivity. Packet delivery may be unreliable. |
| -90 dBm | Unusable | Approaching or drowning in the noise floor. Any functionality is highly unlikely. |
Data from path loss models, RSSI and received signal power allows venues to determine the optimal positioning of APs to obtain the most accurate location data.
Location accuracy
Basic path loss and propagation models, work very well for areas where AP’s can be placed at distance from each other such as in city centres, national parks, or Zoos. This distance ensures that there is no signal interference as a device cannot ping two or more APs at the same time, so we can accurately determine a devices location.
However, this does pose a problem for smaller venues where APs are located in close proximity. Although you can still get an understanding of the number of devices in your venue, determining exactly where those devices are seen can be a little more difficult.
What are we doing to try and improve this?
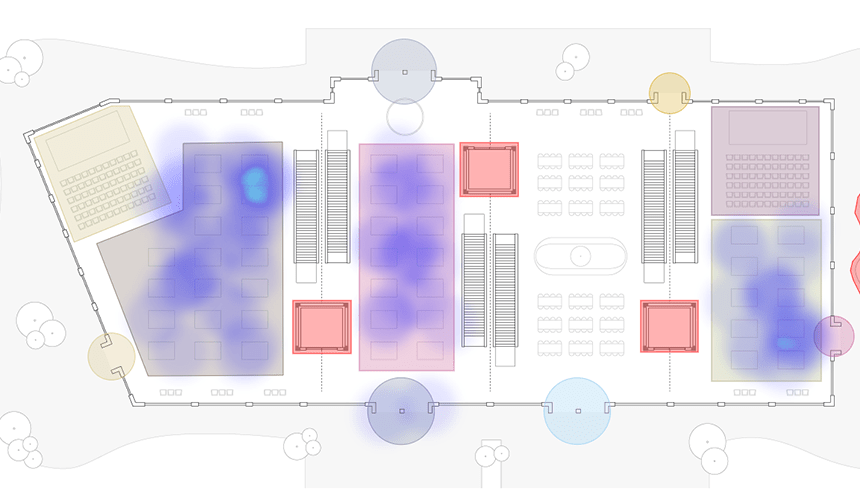
Our research team have studied various models at different customer locations and identified a solution that could significantly improve the results.
By buffering the client probes, analyzing the probes for a certain period of time, and applying intelligence through machine learning to identify the location coordinates where the signal strength has been stronger and probed multiple times, we can create location insights that add value to venues of all sizes.
Fore more information on collecting and analyzing location data, get in touch.